We The People…

I’m sorry, but I don’t have much sympathy for Americans (or anyone) complaining that, for the US presidential election of 2016, there are only two bad choices to choose from; those that wish there were other choices; those that wish the parties had nominated different candidates. To me, these people are like children who, when presented with the option of having a cupcake or a cookie, cry and say they want a Popsicle. Well, there are no popsicles; you only have two choices, and you have to pick one, or one will be picked for you and you may not like the result.

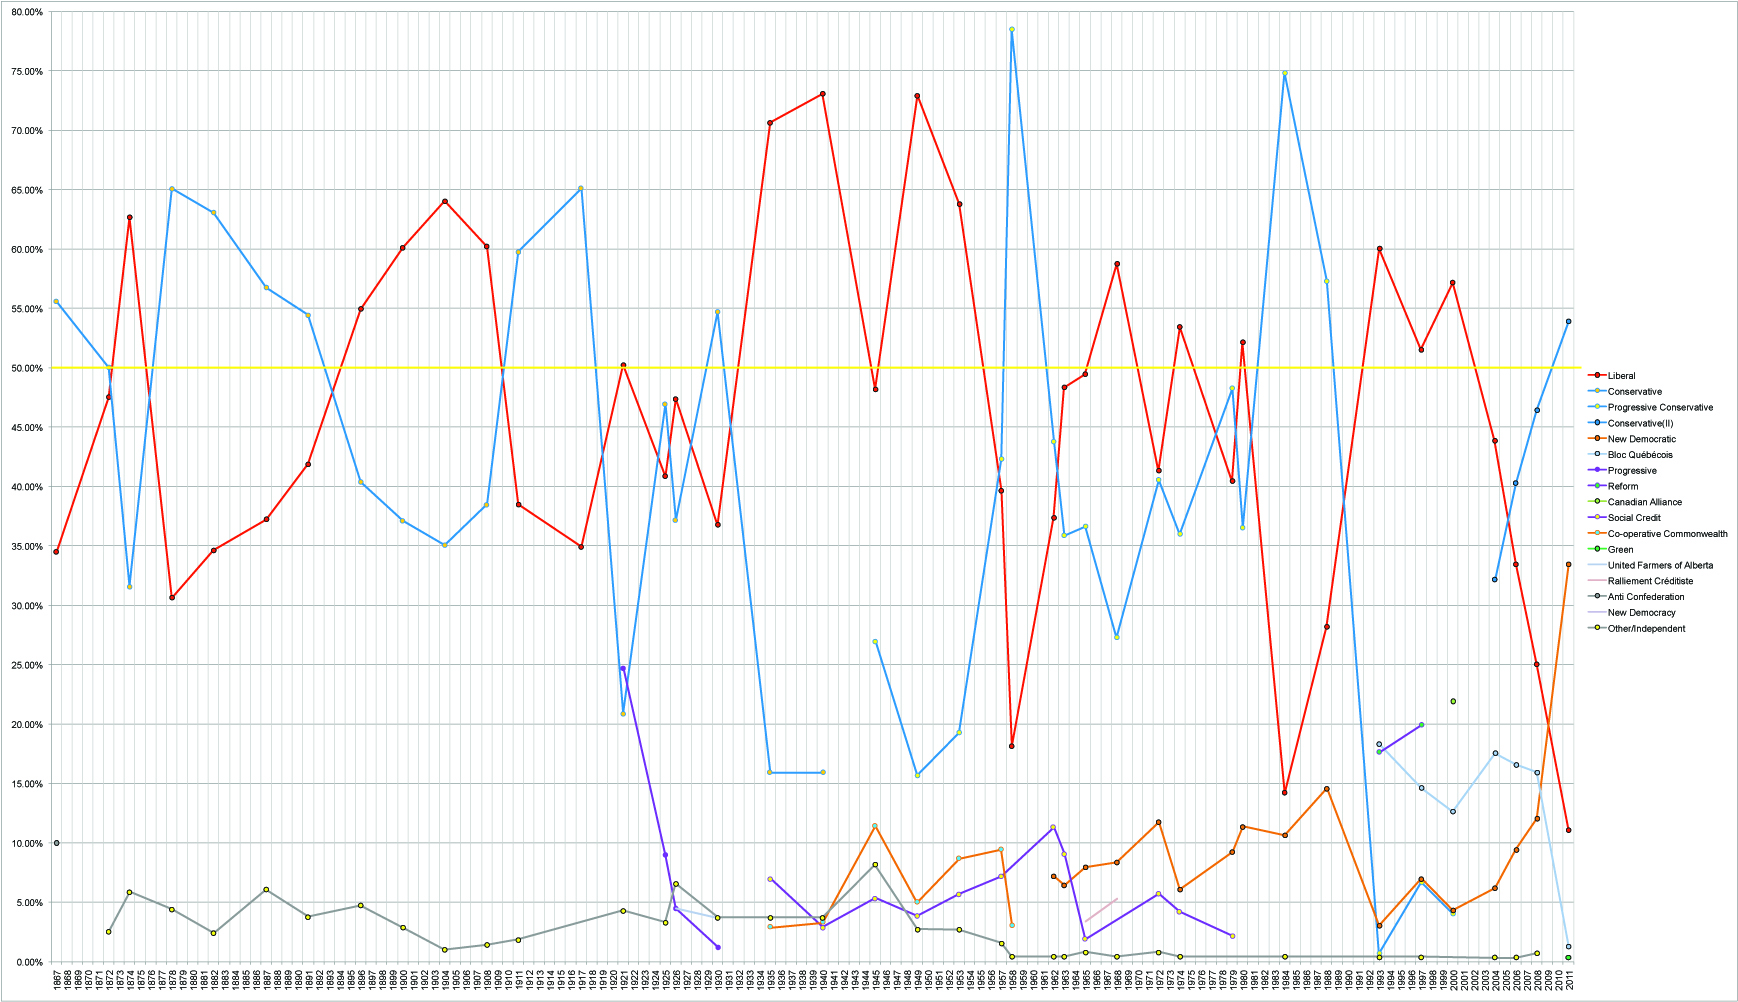
The US Presidential Election system has, essentially, devolved into a “two party” system, but it has pretty much always been a two-party system, particularly after the formation of the Republican Party after the election of 1852, with only a few exceptions. In the last 100 years, there have only been six elections where a third party candidate managed to get even a small portion of the popular vote, and even then, the impact on the election results were negligible.

I would agree that there are many aspects of the overall system that need to be reviewed and possibly changed and hopefully improved. The perceived problems of the system are likely the cause of apparent voter apathy; voter turnout over the past 50 years has averaged barely over 50%. The process by which the parties select their candidates is unbelievably complicated. I totally do not understand the reasoning behind the Electoral College concept. It takes a system by which individuals vote directly for their preferred presidential candidate and turns it into a “first past the post” system, because the individual votes don’t chose the president, the Electoral College votes (cast by the States themselves) do…

But it’s a bit late to be complaining about these facts now. You vote in the system you have, not in the system you wish for, because “… if wishes were horses, we’d all be eating steak.”

In this election, there has been a fair amount of support for the third, independent candidate. Historically, the only time a third party candidate had any significant effect on the election, by getting more of the popular vote and more electoral college votes than one of the two main parties, was in 1912, when Teddy Roosevelt, a former (and popular) President was running under the “Progressive Party” banner. And even then, he only finished a distant second place behind the Democratic candidate (Woodrow Wilson) in the Electoral College, even though Wilson had less than 42% of the popular vote.

Voting in US Presidential elections has always a very close call sort of thing; in the last ten elections or so the popular vote ended up, at most, as a 60/40 split, and usually closer to 50/50. A significant percentage of the voting population tend to vote for one of the two main parties no matter what the issues are, no matter who the candidates are. “I always vote {democrat/republican} because my daddy and my daddy’s daddy always voted {democrat/republican} and that’s just the way it is.” Elections are usually decided in a fight for the small percentage of undecided and independent registered voters.

Voting for an independent candidate is very much like not voting at all, since they are highly unlikely to ever get enough votes to win. Even worse, votes that go to a third party candidate can split the vote, and cause candidates with lower popular vote results to get more electoral college votes than they really deserve, due to the “first past the post” aspect of the system. This is likely what happened in 1912.

Sure, in this election both main candidates have issues. But the media has been consistently trying to portray it as a “close race,” emphasising some of the so-called scandals to try to create a false sense of both candidates being equally bad, because a close race is a news story that generates viewers and makes money. But the reality is, it’s not close. Not at all. One of the candidates is orders of magnitude worse than the other, by any measure anyone would care to use. One candidate is competent, balanced, experienced and qualified for the job, despite any minor transgressions that have been blown out of all proportion by the media, and have been investigated thoroughly with no charges filed. The other candidate is flagrantly unqualified, dangerously unstable, intolerably ignorant, misogynistic, hate-filled, deceptive, mendacious, small minded, elitist, pompous, hypocritical, plutocratic, racist and far less successful, business-wise, than many people assume… and should by no means ever be given any job that involves authority or responsibility over anyone, much less the leadership of one of the most powerful nations on Earth. Simply put; the absolutely worst candidate for the office of President in the history of the United States. Sure, nobody likes being in the situation of having to pick the “least worst” option, but in this election, doing that should be a total no-brainer for anyone.

All this combines to make this one of the most important presidential elections in history, even if it is the sort of thing the founding fathers would probably have had nightmares about. You can’t change the system now; it’s too late for that. This is the system you have, and these are the candidates you have, America. Once this election is done, you can (should!) work to make changes to keep it from happening again. In the past, many voters didn’t care who became president because there was little to distinguish one candidate from the other. But this year it’s different. The differences between the candidates are massive. So every single vote counts. The people of the US cannot afford to be apathetic in this election. I would highly encourage each and every one of my US friends to vote. I won’t tell you how to vote, but I think in this case, it’s not a question of choosing between the cookie or the cupcake and not caring which one you get. It’s not a question of choosing between two sandwiches made with pretty decent ham, but one is on moldy brown bread and the other is on moldy white bread and neither has mustard. It’s a question of choosing between a day old, plain donut and a literal shit sandwich. And I’d rather not have to eat shit.

Apple’s latest

So, the new Apple iPhone has no headphone jack. For some people, this is an outrage; utter arrogance; a gross insult never to be borne; a colossal mistake; the final straw that breaks the camel’s back; proof that Apple has lost it and doesn’t have a clue how to run a business; the final reason they will never, ever purchase an Apple product and anyone who does is obviously an idiot and does not understand… blah blah blah, wanh, wanh, wanh.

Look, if you choose to not buy an iPhone, that’s your decision. I’m sure you got there through a logical process that considered all the facts and issues that are important to you, whatever they may be. I’m sure you’re not the type of person who would refuse to consider an Apple product just because it’s made by Apple. Or maybe you are, whatever. I’m sure you have your reasons. If not having a headphone jack is a deal breaker for you, then fine, don’t buy an iPhone. Good for you. Off you go, then.

But at that point, I would insist on the following:

Allow me to make my own decision on whether or not I buy a new iPhone. Assume, as I did for you, that I will arrive at my decision through my own, logical process, that considers all the issues important to me. Do not, ever, assume that your decision process and conclusions are automatically applicable to me; do not assume that your logic is universal. It’s a very subjective thing, choosing a phone (or any consumer product, really); no choice is provably “right” or “wrong” for everyone; it’s personal. I don’t bitch to you about your choice of car, kitchen appliances or beer; don’t bitch to me about my choice of phone.

Do not, ever, assume that, if I choose to buy a new iPhone (or any Apple product), that I am only being an Apple “fanboi” or some sort of mindless automaton that simply buys whatever Apple makes just because Apple makes it, and that I can’t possibly be making the right choice. Rest assured, I consider all the factors important to me, based on my knowledge, experience, and personal situation, when deciding what to buy, be it beer, kitchen appliances, cars or phones.

And, most importantly, shut the fuck up about it. Seriously. I don’t care what you think about the new iPhone, or if you’re going to buy one or not. I really don’t. Could not possibly care less. Likewise; I don’t care what you think about Apple. Absolutely nothing you say to me will make me change my mind, and believe me, I have no desire to try to change yours. You have made your choice, now shut up and carry on. You don’t have to explain your choice to me. Really, you don’t. As in, I don’t want you to. Because I don’t care. The more you drone on about it, and how “right” you are and how “wrong” I am, and obviously if I think about it, I will see the logic of your choice and realize how wrong I am… just makes me want to either “knife hand” you in the face, punch you in the throat, or kick you in the crotch. Really, really hard. Twice. Equally, I don’t have to explain or justify my choices and thought processes to you, and I won’t. You’re welcome.

If you can’t get over these points, then piss off. Really.

Canadian Election History

Some Parenthetical Thoughts on the History of Canadian Elections.

Canadians head to the polls on 19 October, 2015 for another Federal Election. This election will determine the composition of the 42nd parliament of Canada, and I think it’s interesting to look over the previous Canadian federal election results, as we prepare for this upcoming election.

Finding the data isn’t very difficult; for each election we’ve had, there is a specific and detailed Wikipedia article on that election. They cover a lot of information; party leaders, debates, issues, voter feelings and turnout and (of course) results. What follows is an examination of that data.

There have been 41 Federal Elections in Canadian history; from the first in 1867 to the most recent in 2011. There has been an Election, on average, every 3.6 years, with the longest time between elections being 6 years (from 1911 to 1917) and the least time between being 1 year (which has happened 4 times; 1925-1926, 1957-1958, 1962-1963, and 1979-1980).

The number of seats in parliament has steadily increased from 180 in the 1867 election to 308 in the elections of 2004, 2006, 2008 and 2011. The number of seats in parliament will be increased once again to 338 for the 2015 election.

As mentioned, we can easily find out all the results of every election ever held. It’s also a simple task to put all that data in a spreadsheet, and anyone who knows me knows that I love me a good spreadsheet. Once we have that data, well it just makes sense to plot it on a graph. So, if we plot the number of seats won by each party in each election, we get the following, interesting graphic (click to open an embiggened version in a separate tab):

Graph of Canadian Election History

Historic Canadian Election Results

Ok, yes; it’s a bit of a spider’s nest. But some key points to observe as you look at it: The red line shows the results of the Liberal party; the blue lines are the 3 iterations of the Conservative party; The second Orange is the New Democratic Party (the first Orange line is the “Co-Operative Commonwealth Party, a democratic socialist party that was the predecessor of the NDP), Light Blue is the Bloc Québécois and purple is used for some of the other parties that have won seats over time. The Green Party would be shown by a green line, but they only have one result (from the 2011 election), so it shows as a single dot, way down in the bottom right corner. The graph shows the percentage of total seats available won by each party, at a point immediately after the election. The composition of seats and parties varies during the time between elections, so this graph is not an accurate representation of what the parliament looked like just before each election was called. The 50% line (shown in Yellow) is the dividing line between Minority Governments (where the party that won the most seats has less then half the seats in parliament) and Majority Governments (where the part that won the most seats has more than half the seats). Of the 41 governments that have been formed, 28 of them have been Majorities and 13 have been Minorities, or 68.3% and 31.7% respectively.

The very first election was won by the Conservative party. And since then, there has been a definite pattern of the Liberals and the Conservatives “trading places” every so often, with other parties managing to move up to as high as second place (becoming the official opposition party) but never managing to form a government. Over the past 4 elections, both the current Conservative party and the New Democratic party have been gaining seats from election to election, while the Liberal and Bloc Québécois parties have been steadily losing seats.

The Largest Minority government occurred in 1872, in the second federal election ever held; where the original Conservative party won exactly 50% of the 200 seats in Parliament. One more seat would have given them a proper Majority.

The Smallest Minority government occurred in 2006, when the current (third) iteration of the Conservative party won just 124 of the 308 seats available, giving them only 40.26% of the seats in Parliament.

For Majority governments; the “thinnest” majority was in 1921, when the Liberals won 118 of the 235 seats, or 50.21%. The largest majority was in 1958, when the Progressive Conservatives (the 2nd iteration of the Conservative party) won 208 out of 265 seats, or 78.49%.

In terms of “closeness”; the closest election, with the least number of seats difference between the winning party and the official opposition, was in 1972, where only 2 seats separated the governing Liberals and the second place Progressive Conservatives (109 and 107 respectively). The largest difference was in the 1984 election, where the governing Progressive Conservative party had 171 more seats than the Liberal party (211 and 40, respectively), of the 282 seats available. In the most recent election (2011) the New Conservative party won 63 more seats than the second-place New Democratic party.

The largest number of parties to win seats in any single election was 5 (not including independent members of parliament), and this happened in the elections of 1940, 1965, 1993, 1997, 2000, and 2011. Interesting to note, 5 out of these 6 parliaments had Majority governments, and the one Minority (in 1965), the winning party had 49.43% of the seats available. So having a large number of parties in an election does not always mean we will have a minority government.

Turning to individual Parties;

The Liberal Party has formed the government 22 times; 16 times with Majorities, 6 times with Minorities.

The Conservative Party has had three different “versions” over the years; “The Conservative Party” from 1867 to 1940, “The Progressive Conservative Party” from 1945 to 2000 and the “(New) Conservative Party” from 2004 to today. Combined, these three “versions” of the Conservative party have formed the government 19 times; 12 times with Majorities and 7 times with Minorities.

These are the only two federal parties to have ever formed the government in Canada. As a matter of fact, up until the election of 1993, the Liberals and Conservatives were the only parties to win more than 15% of the seats in parliament, and the most recent result for the New Democrats mark the first time any party, other than the Liberals and Conservatives, held more than 25% of the seats in parliament.

In terms of “streaks;” the party which won the most number of elections in a row was the Liberals, with 5, and they did it twice: in the elections of 1935, 1940, 1945, 1949 and 1953 as well as in the elections of 1963, 1965, 1968, 1972, and 1974. There have been several times when a party has formed the government after 4 elections in a row; the most recent was the Liberals again in the elections of 1993, 1997, 2000 and 2004 and the first was the Conservatives in the elections of 1878, 1882, 1887 and 1891. The current Conservative party has formed the government after the last 3 elections; 2006, 2008 and 2011.

The party who wins the second largest number of seats forms the official “opposition” in parliament. The Liberals and Conservative (all versions combined) parties have each done this 18 times. The New Democratic Party, the Bloc Québécois, the Progressive Party, The Reform Party and The Canadian Alliance Party have each been the official opposition once.

The percentage of seats won by the Liberals has varied from a high of 73.06% in 1940 to a low of just 11.04% in the latest election in 2011. The Conservatives (all versions) have ranged from 78.49% in 1958 to a very low 0.68% (just 2 seats in parliament!) in 1993. The New Democratic party has ranged from 33.44% in 2011 to 3.05% in 1993.

The most recent election in 2011 is unique in that it is the only time, out of 41 elections, that the Liberal party did not either form the Government or the Opposition after the election; that is, the only time they did not place either 1st or 2nd in the election in terms of number of seats won in parliament.

The most recent election was also the best showing the New Democratic party has ever had, and it was the first time the Green party has managed to win a seat in Parliament, albeit only one. Finally, the Bloc Quebecois had their worst result ever, winning only 4 seats, or 1.3%, compared to their best (and first) result in 1993 with 18.31% or 54 seats, when they were the opposition to the governing Liberals. And they managed that despite running candidates in only 75 of the 295 ridings.

Going back to 1867 and the first federal election, one of the parties that ran was the Anti Confederation Party, a maritime based party who were opposed to the idea of Confederation and wanted some, if not all, of the Atlantic provinces to withdraw from Confederation. They managed to win 18 of 180 seats in Parliament in that first election, but they never won seats again. Other parties to have won seats in only a single election (besides the Anti Confederation party in the first election and the Green party in the most recent one) include The Canadian Alliance Party and the New Democracy Party (which is not the same party as the New Democratic Party…). The Liberals and the Conservatives (all versions) are the only parties to have won seats in every election so far. The New Democratic party has the next best set of results, having had members elected in 17 of the 41 parliaments.

Note that the results we’ve been discussing, and the chart above, show only those parties who actually managed to win seats in parliament, not the parties who ran candidates but failed to win any seats. For example, in the 2011 election, 5 parties won seats, but 18 different parties (including the Communist Party, the Marijuana Party, the Pirate Party and the infamous Rhinoceros Party) fielded candidates in the elections, albeit some in only 1 riding. There were also 61 independent or no affiliation candidates in the 2011 election, although none of them won seats in parliament. The number of seats won by independent candidates has ranged from 0 (in 7 of 41 elections) to a high of 20 in the election of 1945.

At the time this next election was called, the inter-election changes of the numbers of seats for each party saw the Conservatives lose 7 seats and the New Democrats lose 8. The Liberals gained 2, while 8 members of parliament became Independants. The Bloc Québécois lost 2 seats and the Green Party managed to gain 1 seat for a total of 2. And a new party, the “Strength in Democracy” party, formed, and held 2 seats just before the election call.

So, how will things go in the 2015 election? I haven’t a clue. In this case, the historic data and past results that we have been looking at have very little (if any) effect on how the next election will go. That is, this data cannot be used to predict any results for upcoming elections. Yes, there have been cases where a party would show a few increases in sequential elections, only to drop significantly at the next election. And cases where a party went from a very low number of seats in one election to a firm majority in the next. So we’ll just have to see.

One thing that has not been discussed is the fact that our parliamentary system is based on a “first past the post” process. Some feel that this process is less than ideal, to put it mildly, and they advocate for changes to our system to something that involves a proportional process, that may better reflect the desires of Canadians when it comes to their government. But I digress… that is a topic for a different blog post.

In the meantime, and most importantly, I strongly urge all Canadians who can vote to do so. It is one of the most important things you will ever do in your life. Voter turn out in our country has generally been ok… but not great. I only have data from the last 19 elections; 1957 through to 2011, but looking at those numbers show that Voter Turn Out has varied from a high of 79.4% in 1958 to a low of 58.8% in 2008. And the trend has been downward, unfortunately. That is something we need to fix. No changes or improvements in the system are possible unless we make our voices heard and that can only be done if we vote. If you vote. If your friends and family vote. If we all vote. Every vote counts. Even if you vote for a party that wins no seats, your vote is still registered, still counted, still analyzed, and still important to this great country and everyone in it. Voter Apathy is something the politicians are happy to see; if you don’t vote, that means you don’t care and they can do whatever they want. We have to show them that, in Canada, as in any Democracy, the people have the power. People died to protect your right to vote. There are people in other countries who would love to be able to vote, but they can’t because they live under an oppressive government. But you, my fellow Canadians, you can vote. So go out there and get it done! Vote!!

Testing

1, 2, 3… is this thing on??

Welcome to the Club

Well, Apple released it’s financial results for the fourth quarter of fiscal 2011 today. And once again, it was a doozy.

Revenue for the quarter was $ 28 Billion; a bit less than the last quarter (which I actually did not expect) but a 39% increase over the year-ago quarter. Unit sales of all products were good, with iPhone and iPod units down slightly from the last quarter, but Macs and iPads up. They actually sold 11 Million iPads last quarter and 17 Million iPhones. iPhone accounted for almost 39% of their quarterly revenue, while iPads made up 24%.

But the big news (for me) was that, with this quarter’s results, we can determine that their annual revenue for 2011 was a grand total of $108,249,000,000. That’s just over $108 Billion, putting Apple into the “Billion Dollars a Year Club” for the first time.

You may recall, in my last blog post, I went out on a limb and predicted something between $113 and $116 Bn, and a Fortune 500 Position of somewhere around 15th or 16th place. As I was a bit short on the revenue, I will modify my Fortune 500 prediction to around 16th or 17th place, still well ahead of last year’s 35th spot; a record showing for them up to that point… but that depends, of course, on how well the other members of the club do with their fiscal results; as Einstein says, “It’s all relative.” Unfortunately, we’ll have to wait until the Fortune 500 list comes out, sometime around the end of May 2012, to know for sure.

But looking at that revenue figure…that would put Apple ahead (in terms of revenue) of companies like IBM, Wells Fargo and Proctor and Gamble. And way ahead of Microsoft, Dell and Intel.

As usual, based on this good news, Apple’s stock price has taken a beating and gone down, but it is worth noting that, at market close today, Apple had a Market Cap of $391 Billion (an almost 2 month high), ahead of Exxon Mobil by almost $8 Billion, making Apple the largest company in the US by Market Cap once again. This number will likely change significantly during tomorrow’s trading, of course (and as Mr. Gruber notes on his blog, now is probably a great time to buy some Apple stock… but I digress).

I may post some graphs and other analysis later, but I wanted to get this initial reaction onto the intertubes tonight.

Cheers!


News and Numbers from Apple

First off, Apple’s new iPhone, the 4S. Some are miffed that it’s not “iPhone 5.” Some are miffed that it is, essentially, only a minor improvement over the iPhone 4. Some are wondering why they would replace their current iPhone 4 with one of these. To all of these people I say… je ne give a shit pas, I’m getting me an iPhone. I’ve been waiting to get an iPhone for more than 3 years now (long story… no, a short story: got locked into a contract. Bleh) and I *need* a new phone.

iPhone 4S

(Some may say “want” but I say “need.” Because I need it. I do. Me. Need. Need a new phone. Now. Yes. Need. But I digress…)

Oh, and to those who already have an iPhone 4; you probably have a contract, so the fact that this phone is only an incremental upgrade is probably a good thing for you. Yay! Think how much more pissed off you’d be if this was THE GREATEST PHONE ON EARTH… and you couldn’t get one because you were locked into a contract. Meh. (How’s that for ‘silver lining’ thinking?) Of course, if you’re not locked into a contract and you’re wondering if you should dump your iPhone 4 for an iPhone 4S… I’d probably say ‘no,’ but it’s up to you, dude. Don’t let me tell you what to do. And don’t listen to those dumbass pundits and so-called ‘experts,’ either. Figure it out yourself.

But the other interesting thing that happened today had to do with “AAPL,” that is to say, Apple’s stock and the price thereof.

A while back, you may recall, Apple’s Market Cap exceeded that of MicroSoft. Market Cap, or Market Capitalization, is a measure of how large a company is. Essentially, you take the company’s stock price and multiply that by the number of stocks issued, and you get the company’s Market Cap value (measured in good old dollars). Bigger is better. It is ‘a’ measure of the size of a company, but by no means the only one.

When Apple surpassed MicroSoft on this scale, it was a pretty Big Deal(TM). And, at that time, the only company with a bigger Market Cap was Exxon Mobil (Ticker: XOM). And slowly but surely, Apple started to close that gap.

Market Cap is one of those things that you hear a lot about in the news, probably because it is so volatile. Market Caps go up and down every day, while we have to wait a whole boring three months to get a company’s quarterly financial reports. So Market Cap swings make for great news.

Well, as Apple started closing that gap, I started keeping track of the numbers. And like any good engineer would, I graphed them. Thus, I present:

(Click to Embiggen in a new Window)

This is a graph comparing the Market Caps of AAPL and XOM, from the 25th of August 2011 until today. The numbers on the vertical axis are in Billions of Dollars. As you can see, AAPL briefly exceeded XOM on the 26th, and they danced around for a couple of days… and then, on the 8th of September, AAPL pulled ahead… and stayed ahead. At one point (23 September), AAPL was ahead by $37.8 Billion. At that point, Apple Inc was, essentially, *the* largest company in the US (by Market Cap), and probably one of the top three or so largest companies in the world.

Their peak was on 20 September, where, by Market Cap, Apple (the company) was worth $383 Billion dollars. That is to say, that’s what it would cost you to buy each and every stock of AAPL out there. Unlike *some* companies I could name (*cough*dell*cough*rim*cough*hp*cough*), whose Market Cap is well within the ability of Apple to buy… out of petty cash. But I digress…

AAPL stayed ahead (albeit only by a paltry $380 Million on 30 September) until today. And, as usual for Apple, during today’s announcement of a new product (what for most companies is good news) their stock took a pummelling, while XOM surged and over took, giving Exxon a Market Cap lead of $8.7 Billion.

As I said, this is typical for Apple. Their stock always seems to go down when they have good news to announce. Ah well, c’est la vie, as they say. But it will be interesting to watch the stocks and see how the Market Cap numbers go over the next few months. Some have predicted that, not only will AAPL exceed XOM in Market Cap value, but AAPL may be the first stock to reach a Market Cap of $1 Trillion. (OK, admit it; you read that in Dr. Evil’s voice, didn’t you? I know I typed it in his voice, so it’s understandable if you did.)

The other interesting thing you get from these numbers, when compared to the actual stock prices of the two companies: Apple has a whopping 927 Million shares on the market, while Exxon has issued a mind boggling 4.8 *Billion* shares. So if you own a few shares (of either company)… it’s probably pretty insignificant. You’re welcome.

And now that September has ended (someone wake up that Green Day guy), we look forward to another of those quarterly financial results announcements. This next one will be for the fourth quarter of 2011, so we’ll be able to aggregate the numbers for the annual results also. And I am going out on a limb and predicting that Apple’s gross annual revenue will exceed $100 Billion this year. Obviously, sales of this latest iPhone will not have an effect on 2011 annual figures, as the next three months are the first quarter of fiscal year 2012. But recall that iPhone 4 was a very successful product, one of the most popular selling phones of the time. Not to mention income from iPad 2. Oh, yeah; and they also sell computers. Heh.

But let’s think about that for a moment. Last year, there were only 17 companies on the Fortune 500 whose gross annual revenue was more than $100 Billion. The biggest of those was Wal Mart, with $421 Billion. That’s no surprise; they’ve been #1 all but three times in the last 10 years, and those times, they were a close #2.

So the “$100 Billion a year club” a pretty exclusive group of companies. And I am predicting that Apple will join them for 2011. As a matter of fact, I’ll double down on that bet, and predict total annual revenue somewhere between $113 and $116 Billion, which should place them somewhere around 15th or 16th on the Fortune 500 list. So stay tuned, kids! We’ll have to wait for Apple’s quarterly results, and for the good folks at Fortune Magazine to produce the 2011 list, but I’m betting it will be worth the wait.

Cheers!

Putting Up Some Big Numbers

Apple released it’s quarterly financial results today, for the 2nd quarter of 2011 (Jan – Mar 11). As many people have noticed, they put up some big numbers, yet again. Just some quick highlights:

Once again, the best, non holiday quarter ever, with $24.667 Billion in revenue and $5.99 Billion in profits. A while back I predicted that Apple would join the “$100 Billion Revenue a year” club in FY 2012, and they seem to be on track for that with these numbers.

They shipped just over 4.5 Million iPads in the quarter, bringing the grand total since introduction up to almost 19.5 Million. Almost 20 Million in just 4 quarters. It’s interesting how fast iPad is being adopted; it took iPhone 8 quarters to reach the 20 Million mark, and iPod took 12 quarters to reach that number.

Unit sales and revenue for every product was down significantly from the previous quarter (which was the holiday quarter)… except for iPhone. iPhone sales were actually up quite a bit from the previous quarter (113% to be precise, Captain), with 18.6 Million units shipped, generating almost $12.3 Billion in revenue. I expected iPad sales to be down, following the same “jig saw” pattern we’ve seen with iPod sales, but it’s interesting that iPhone did not follow that paradigm. It’s also interesting to note that iPhone accounted for just shy of 50% of Apple’s total revenue for the quarter. 49.86%, if you want to be picky about it…

Gruber and others have noted that the year-over-year gain in revenue and profits was 83% and 95% respectively. That’s the best year-over-year gain in revenue that Apple has seen for at least the past 14 years… but not for profit. As a matter of fact, the year-over-year gain in quarterly profit from Q4’08 to Q4’09 was a very impressive 122%; $1.1 Billion to $2.5 Billion. And even that’s peanuts compared to way back in 2005; Q2’04 to Q2’05 profits increased by an amazing 530%, from $46 Million to $290 Million.

Still waiting to see how they did on the Fortune 500 list for FY 2010. I’m predicting a placing of 31st, comfortably in the top 50 and much better than their best-so-far (official) place of 56th on the 2009 list.

Cheers!

Apple’s Latest

Ok, I know my blog has become, more or less, an “Apple’s Latest Financial Numbers” blog. Such was not my intent, but my current schedule and other responsibilities severely restrict my parenthetical thinking. It will eventually (I am certain) return to normal, but not for a while. In the meantime…

Earlier this week, Apple announced their numbers for Q4 of 2010. And, as expected, they were very good (once again, their best quarter *ever*).

Revenue for the Quarter was over $20B, bringing the grand total for FY 2010 to just over $65B. As I expected, this should place them comfortably above the 50 mark in the 2010 Fortune 500 list of the largest companies. Depending on how things play out for the others on the list, they may even make it into the low 30s. I’ll go out on a limb and predict 35, just to pick a number, and we’ll see how I do, ok? Gotta wait for the list to come out.

Revenue for FY 2010 was also increased by 52% compared to FY 2009. And the average increase in Apple’s annual revenue for the past 5 years has been 36%. That’s amazing. So, based on that, I’ll make a second prediction also. That by 2012 (two years from now), Apple will join the “$100B a year club.” And I bet they get there before Microsoft and before Dell. Keep tuned here to find out how I do! But I digress…

Interestingly, most of their revenue for FY 10 was from iPhone; about 38% total. CPUs (laptops and desktops) accounted for about 27%, and iPods for almost 13%.

Now, as you may know, the Fortune 500 list places companies in “industries,” based on where they get their revenue. There was a bit of a kerfuffle a while back when General Electric was moved to the “diversified financials” industry, because that’s were they were making most of their money.

Apple has, up to now anyway, been placed in the “computers and office equipment” industry. But with most of their revenue coming from iPhone, will that still be the case? I don’t think there’s a “cellphone” industry in the Fortune 500. We shall have to wait and see, I guess.

Even more interesting, as has been noted by others, between iPhone and iPad, in Q4 2010, Apple generated almost 60% of its revenue from products that did not even exist 5 years ago. And iPad has been an amazing success; in Q410, they sold more iPads than CPUs. And, of course, more iPods than iPads, and more iPhones than iPods…

Another example of how successful iPad has been; if we look at their last three “new” products, and their first quarter of availability:

  • iPod: Q402, where they sold 140,000 units and generated $53M in revenue.
  • iPhone: Q307, where they sold 270,000 units and generated $5M in revenue.
  • iPad: Q310, where they sold 3,270,000 units (!) and generated $2.16BILLION in revenue!

So, in the first quarter that Apple started selling iPad, they were already a $2B per quarter, $8-$10B a year business. Amazing. As Gruber has noted, there is no way Microsoft and Intel, not to mention Dell, HP and RIM, are not paying attention to this…

But even more interesting… if we look at those same three quarters, and look at Apple’s CPU business at the time:

  • Q402: 734,000 units, $1B revenue
  • Q307: 1,760,000 units, $2.5B revenue
  • Q310: 3,470,000 units, $4.4B revenue

So, while it is true that iPod, iPhone and iPad have been huge successes for Apple, and apparently growing quite nicely, it is also true that Apple’s CPU business (which was pretty much it’s ONLY business 8 short years ago), has been doing very well also. Apple is still a computer company, and, as I noted in my last, short blog post; the combined CPU and iPad sales have given them some significant gains in Market Share.

Oh, and speaking of the Market… just did a quick check of the stock market. Apple stock is trading at 307.47 a share, putting its Market Cap at 281.63B, and making Apple the second largest company by Market Cap. Exxon Mobil is still number one, with a Market Cap of 337.79B… based on a stock price of 66.34 a share… I think it’s still possible for Apple to become number one, but given the variable nature of the stock market, it’s impossible (for me anyway) to predict when. We’ll see.

Cheers!

Mac Sales

OK; I’m working on a longer Blog entry, but I just noticed something I want to get out right away.

Today, Apple held a special event, where they discussed the Mac. They talked about the next version of OS X (Lion), the new Mac Book Airs, and a few other things. They also noted that the Mac business was worth $22B in 2010.

But waitaminit… by my numbers (which are from Apple’s own quarterly Data Sums), CPU revenue (Laptops and Desktops) for 2010 was just under $17.5B… not $22B. What gives? But then I noted that, for 2010, iPad revenue was almost $5B… aha! As Ihnatko might say; “J’Accuse, Apple!” I saw what you did there. We all know that including iPad as a (some would say successful) competitor to those silly Winduhs “netbooks,” gives Apple a huge leg up in the “Market Share Wars.” Well played, Mr. Jobs… well played sir!

Apple’s latest numbers

(I am not a number! I am a free man!)

So, a couple of days ago, Apple released its results for the latest fiscal quarter, Q3 of 2010. And, once again, the numbers were good.

They had profits of $3.25 Billion, on revenue of $15.7 Billion; this was their best quarter ever. Take a look at that again; their best *quarter* ever, not their “best non-holiday quarter ever.”

That is to say, Q310 had higher revenue than Q110, the quarter that includes the annual spend-a-thon known as Christmas. For the past few years, Apple’s revenue has shown distinct “spikes” for the holiday quarter of each fiscal year, driven primarily by iPod sales, which (as I have noted before) make great Christmas presents. But this year, things were different. It’s also interesting to note that the last time Q1 was not Apple’s best quarter was back in fiscal 2005. Back then, their revenue for the *entire year* was $13.9 Billion, and their quarterly revenue was on the order of $3 Billion… which is what they made as *profit* this past quarter. So it may be a trite statement, but things have changed for Apple over the past 5 years, and changed in a very good way. I think, as time goes on, we will still see the spikes of the holiday quarter, but the new revenue streams of iPhone and iPad will smooth out that line, just a tad.

Breaking the numbers down a bit, we note that iPod unit sales were down slightly, reinforcing a trend that has been going on for some time. iPhone sales were also down very slightly, while CPU sales were up. This was the first quarter that Apple was selling iPads, and they did well, selling 3.2 Million of them; we’ll have to see how those numbers change over the next couple of years.

Percentage wise, iPhone represented 33.97% of their revenue, while CPUs accounted for 28.02%. Surprisingly, iPad was worth 13.8%, quite a bit higher than iPod, coming in fourth with 9.84%. This was the fourth quarter in a row that iPhone revenue was greater than CPU revenue.

A while ago, a friend of mine theorized that Apple had become more of a music company than a computer company. The numbers didn’t bear that theory out, but they do seem to support the idea that Apple has become more of a phone company than a computer company. But, if you consider the iPhone as more of a handheld, personal computer that can do phone calls, maybe not. And the iPad is more of a computer than anything else. Indeed, it may be what computers will look like more and more as time goes on. So I still think we can consider Apple a computer company, first and foremost.

This most recent financial announcement also included the final “revision” of their fiscal 2009 numbers. Using their updated accounting procedures, Q3 of 09 had $1.397 Billion more revenue than what they originally reported, putting their annual revenue at $42.905 Billion, rather than $36.537 Billion. As I noted before, this would have placed Apple in 51st placed in the Fortune 500, rather than the 56th place they actually made. Still, it’s the best Apple has ever placed on that venerated list of US Companies.

A couple of other interesting points were made during their announcement. First, Apple is forecasting revenue for the fourth quarter to be around $18 Billion. Industry analysts said this is “conservative,” as is typical for Apple (they don’t like to brag). But if they do make that number, it would push their annual revenue for 2010 to around $62 Billion. That would be a increase of 46% from 2009, and would push them to the low 30’s on the Fortune 500 list.

The other interesting point was made by Tim Cook, who said that not everything is all rosy and nice. They are having a problem at Apple… mainly in that they cannot seem to meet the demand for iPhone 4 and iPad. They can’t build them fast enough, but they are working through that as best they can. You have to admit, it’s a “good” problem for a company to have.

Finally, I have to note that Apple’s market capitalization was $231 Billion this morning, making them the second most valuable company in the US. Over the past 5 years, Apple’s stock price has increased almost 500%. Which only makes the fact that I did not buy any stock that much harder to take.