Some Parenthetical Thoughts on the History of Canadian Elections.
Canadians head to the polls on 19 October, 2015 for another Federal Election. This election will determine the composition of the 42nd parliament of Canada, and I think it’s interesting to look over the previous Canadian federal election results, as we prepare for this upcoming election.
Finding the data isn’t very difficult; for each election we’ve had, there is a specific and detailed Wikipedia article on that election. They cover a lot of information; party leaders, debates, issues, voter feelings and turnout and (of course) results. What follows is an examination of that data.
There have been 41 Federal Elections in Canadian history; from the first in 1867 to the most recent in 2011. There has been an Election, on average, every 3.6 years, with the longest time between elections being 6 years (from 1911 to 1917) and the least time between being 1 year (which has happened 4 times; 1925-1926, 1957-1958, 1962-1963, and 1979-1980).
The number of seats in parliament has steadily increased from 180 in the 1867 election to 308 in the elections of 2004, 2006, 2008 and 2011. The number of seats in parliament will be increased once again to 338 for the 2015 election.
As mentioned, we can easily find out all the results of every election ever held. It’s also a simple task to put all that data in a spreadsheet, and anyone who knows me knows that I love me a good spreadsheet. Once we have that data, well it just makes sense to plot it on a graph. So, if we plot the number of seats won by each party in each election, we get the following, interesting graphic (click to open an embiggened version in a separate tab):
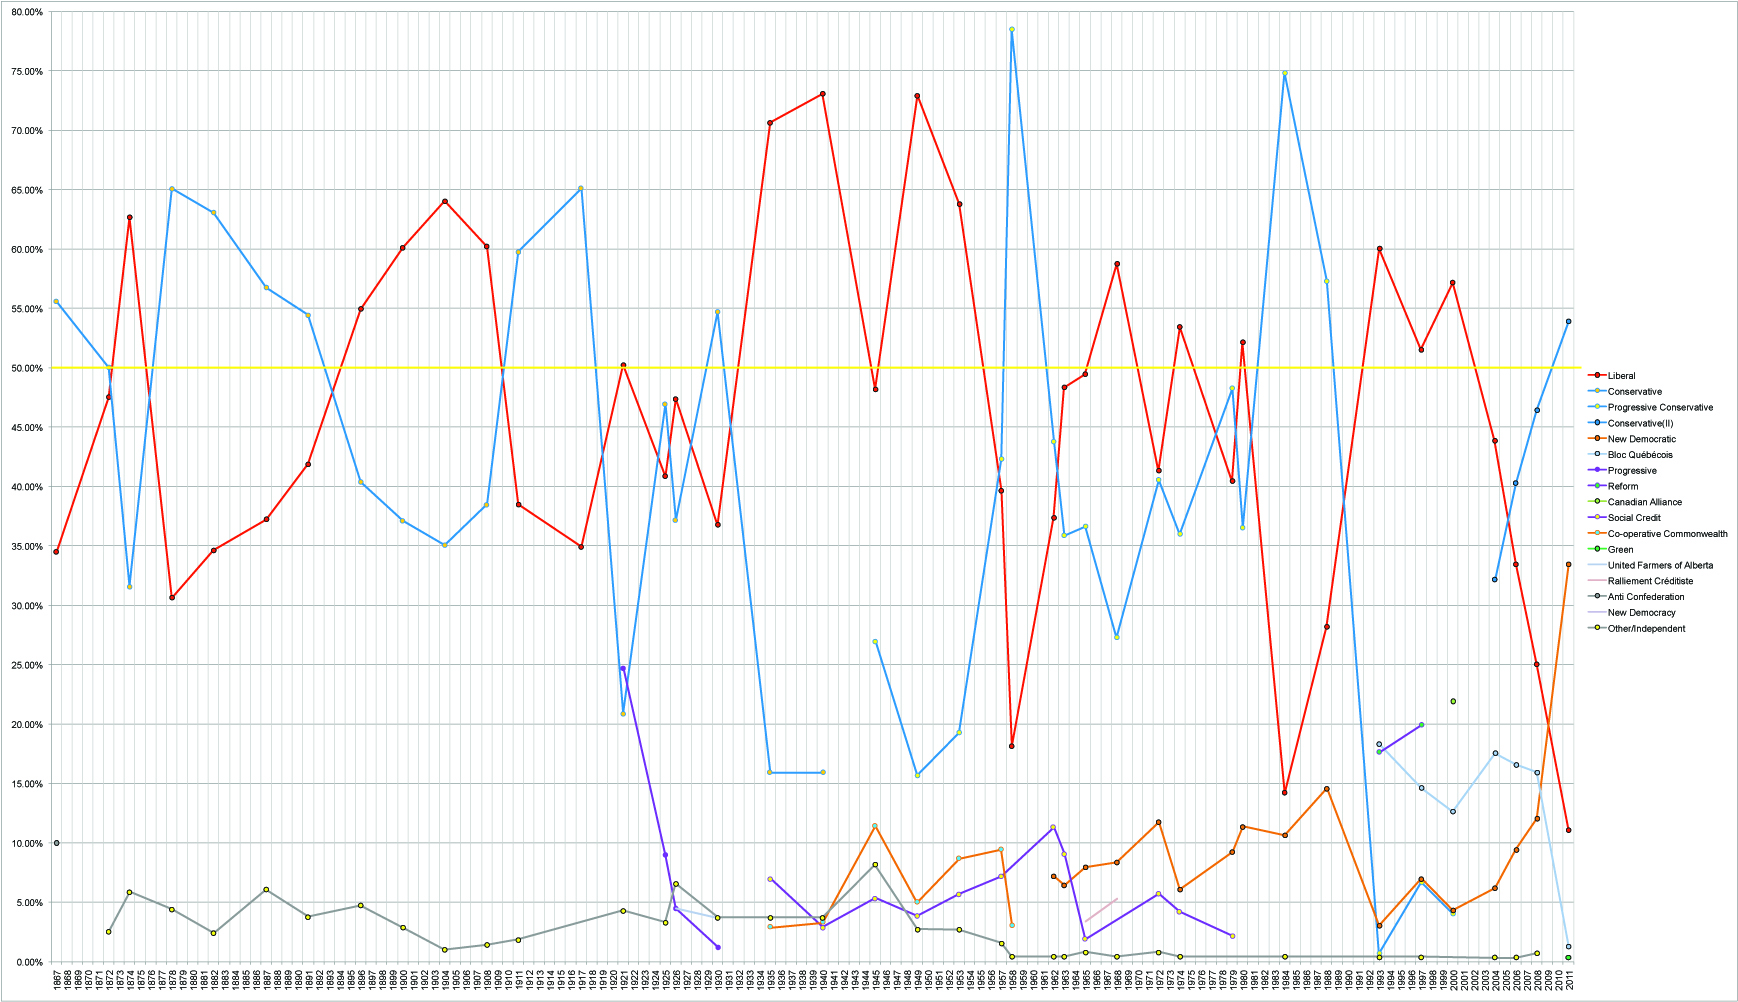
Historic Canadian Election Results
Ok, yes; it’s a bit of a spider’s nest. But some key points to observe as you look at it: The red line shows the results of the Liberal party; the blue lines are the 3 iterations of the Conservative party; The second Orange is the New Democratic Party (the first Orange line is the “Co-Operative Commonwealth Party, a democratic socialist party that was the predecessor of the NDP), Light Blue is the Bloc Québécois and purple is used for some of the other parties that have won seats over time. The Green Party would be shown by a green line, but they only have one result (from the 2011 election), so it shows as a single dot, way down in the bottom right corner. The graph shows the percentage of total seats available won by each party, at a point immediately after the election. The composition of seats and parties varies during the time between elections, so this graph is not an accurate representation of what the parliament looked like just before each election was called. The 50% line (shown in Yellow) is the dividing line between Minority Governments (where the party that won the most seats has less then half the seats in parliament) and Majority Governments (where the part that won the most seats has more than half the seats). Of the 41 governments that have been formed, 28 of them have been Majorities and 13 have been Minorities, or 68.3% and 31.7% respectively.
The very first election was won by the Conservative party. And since then, there has been a definite pattern of the Liberals and the Conservatives “trading places” every so often, with other parties managing to move up to as high as second place (becoming the official opposition party) but never managing to form a government. Over the past 4 elections, both the current Conservative party and the New Democratic party have been gaining seats from election to election, while the Liberal and Bloc Québécois parties have been steadily losing seats.
The Largest Minority government occurred in 1872, in the second federal election ever held; where the original Conservative party won exactly 50% of the 200 seats in Parliament. One more seat would have given them a proper Majority.
The Smallest Minority government occurred in 2006, when the current (third) iteration of the Conservative party won just 124 of the 308 seats available, giving them only 40.26% of the seats in Parliament.
For Majority governments; the “thinnest” majority was in 1921, when the Liberals won 118 of the 235 seats, or 50.21%. The largest majority was in 1958, when the Progressive Conservatives (the 2nd iteration of the Conservative party) won 208 out of 265 seats, or 78.49%.
In terms of “closeness”; the closest election, with the least number of seats difference between the winning party and the official opposition, was in 1972, where only 2 seats separated the governing Liberals and the second place Progressive Conservatives (109 and 107 respectively). The largest difference was in the 1984 election, where the governing Progressive Conservative party had 171 more seats than the Liberal party (211 and 40, respectively), of the 282 seats available. In the most recent election (2011) the New Conservative party won 63 more seats than the second-place New Democratic party.
The largest number of parties to win seats in any single election was 5 (not including independent members of parliament), and this happened in the elections of 1940, 1965, 1993, 1997, 2000, and 2011. Interesting to note, 5 out of these 6 parliaments had Majority governments, and the one Minority (in 1965), the winning party had 49.43% of the seats available. So having a large number of parties in an election does not always mean we will have a minority government.
Turning to individual Parties;
The Liberal Party has formed the government 22 times; 16 times with Majorities, 6 times with Minorities.
The Conservative Party has had three different “versions” over the years; “The Conservative Party” from 1867 to 1940, “The Progressive Conservative Party” from 1945 to 2000 and the “(New) Conservative Party” from 2004 to today. Combined, these three “versions” of the Conservative party have formed the government 19 times; 12 times with Majorities and 7 times with Minorities.
These are the only two federal parties to have ever formed the government in Canada. As a matter of fact, up until the election of 1993, the Liberals and Conservatives were the only parties to win more than 15% of the seats in parliament, and the most recent result for the New Democrats mark the first time any party, other than the Liberals and Conservatives, held more than 25% of the seats in parliament.
In terms of “streaks;” the party which won the most number of elections in a row was the Liberals, with 5, and they did it twice: in the elections of 1935, 1940, 1945, 1949 and 1953 as well as in the elections of 1963, 1965, 1968, 1972, and 1974. There have been several times when a party has formed the government after 4 elections in a row; the most recent was the Liberals again in the elections of 1993, 1997, 2000 and 2004 and the first was the Conservatives in the elections of 1878, 1882, 1887 and 1891. The current Conservative party has formed the government after the last 3 elections; 2006, 2008 and 2011.
The party who wins the second largest number of seats forms the official “opposition” in parliament. The Liberals and Conservative (all versions combined) parties have each done this 18 times. The New Democratic Party, the Bloc Québécois, the Progressive Party, The Reform Party and The Canadian Alliance Party have each been the official opposition once.
The percentage of seats won by the Liberals has varied from a high of 73.06% in 1940 to a low of just 11.04% in the latest election in 2011. The Conservatives (all versions) have ranged from 78.49% in 1958 to a very low 0.68% (just 2 seats in parliament!) in 1993. The New Democratic party has ranged from 33.44% in 2011 to 3.05% in 1993.
The most recent election in 2011 is unique in that it is the only time, out of 41 elections, that the Liberal party did not either form the Government or the Opposition after the election; that is, the only time they did not place either 1st or 2nd in the election in terms of number of seats won in parliament.
The most recent election was also the best showing the New Democratic party has ever had, and it was the first time the Green party has managed to win a seat in Parliament, albeit only one. Finally, the Bloc Quebecois had their worst result ever, winning only 4 seats, or 1.3%, compared to their best (and first) result in 1993 with 18.31% or 54 seats, when they were the opposition to the governing Liberals. And they managed that despite running candidates in only 75 of the 295 ridings.
Going back to 1867 and the first federal election, one of the parties that ran was the Anti Confederation Party, a maritime based party who were opposed to the idea of Confederation and wanted some, if not all, of the Atlantic provinces to withdraw from Confederation. They managed to win 18 of 180 seats in Parliament in that first election, but they never won seats again. Other parties to have won seats in only a single election (besides the Anti Confederation party in the first election and the Green party in the most recent one) include The Canadian Alliance Party and the New Democracy Party (which is not the same party as the New Democratic Party…). The Liberals and the Conservatives (all versions) are the only parties to have won seats in every election so far. The New Democratic party has the next best set of results, having had members elected in 17 of the 41 parliaments.
Note that the results we’ve been discussing, and the chart above, show only those parties who actually managed to win seats in parliament, not the parties who ran candidates but failed to win any seats. For example, in the 2011 election, 5 parties won seats, but 18 different parties (including the Communist Party, the Marijuana Party, the Pirate Party and the infamous Rhinoceros Party) fielded candidates in the elections, albeit some in only 1 riding. There were also 61 independent or no affiliation candidates in the 2011 election, although none of them won seats in parliament. The number of seats won by independent candidates has ranged from 0 (in 7 of 41 elections) to a high of 20 in the election of 1945.
At the time this next election was called, the inter-election changes of the numbers of seats for each party saw the Conservatives lose 7 seats and the New Democrats lose 8. The Liberals gained 2, while 8 members of parliament became Independants. The Bloc Québécois lost 2 seats and the Green Party managed to gain 1 seat for a total of 2. And a new party, the “Strength in Democracy” party, formed, and held 2 seats just before the election call.
So, how will things go in the 2015 election? I haven’t a clue. In this case, the historic data and past results that we have been looking at have very little (if any) effect on how the next election will go. That is, this data cannot be used to predict any results for upcoming elections. Yes, there have been cases where a party would show a few increases in sequential elections, only to drop significantly at the next election. And cases where a party went from a very low number of seats in one election to a firm majority in the next. So we’ll just have to see.
One thing that has not been discussed is the fact that our parliamentary system is based on a “first past the post” process. Some feel that this process is less than ideal, to put it mildly, and they advocate for changes to our system to something that involves a proportional process, that may better reflect the desires of Canadians when it comes to their government. But I digress… that is a topic for a different blog post.
In the meantime, and most importantly, I strongly urge all Canadians who can vote to do so. It is one of the most important things you will ever do in your life. Voter turn out in our country has generally been ok… but not great. I only have data from the last 19 elections; 1957 through to 2011, but looking at those numbers show that Voter Turn Out has varied from a high of 79.4% in 1958 to a low of 58.8% in 2008. And the trend has been downward, unfortunately. That is something we need to fix. No changes or improvements in the system are possible unless we make our voices heard and that can only be done if we vote. If you vote. If your friends and family vote. If we all vote. Every vote counts. Even if you vote for a party that wins no seats, your vote is still registered, still counted, still analyzed, and still important to this great country and everyone in it. Voter Apathy is something the politicians are happy to see; if you don’t vote, that means you don’t care and they can do whatever they want. We have to show them that, in Canada, as in any Democracy, the people have the power. People died to protect your right to vote. There are people in other countries who would love to be able to vote, but they can’t because they live under an oppressive government. But you, my fellow Canadians, you can vote. So go out there and get it done! Vote!!