Well, as I said yesterday, I’ve been working on this blog post for a while now… almost two years. Well, not exactly “working” on it, more like “waiting for the data to come in.” You’ll know what I mean in a bit. And, yes, I know; it sounds a bit pathetic… but what can you do?
The genesis of it was a discussion I had with my good friend, Mr. Squid. I believe he responded to an Apple-related post on my old blog site, wondering if Apple could still be considered a computer company, or if they were making more money from iPods than from computers.
Because I had been tracking Apple’s Financial results for a while, I was able to give him information that confirmed, while there were times when Apple made more money from iPods than from computers, in general, computers were still the key to their business. Sure, they are more of a “consumer electronics” company, but CPUs are still what drives them.
In the meantime, I’ve done some additional research and pulled out some more numbers, especially some of their older financial results. But before I was able to make this blog entry, I wanted to wait until I had all the data for all of 2009.
Well, as of this past Monday, Apple has released their results for the fourth quarter of 2009. And impressive results they were, indeed. Other companies seem to be suffering from the recession; losing money or having “disappointing” results. But Apple did well. Not just well, but very well. I echo Mr. Gruber’s reaction: Yowza.
So, armed with all this data, what do we do? Well, as we all know, “these points of data make a beautiful line.” So let’s make some graphs! After the cut, I have posted a bunch of the graphs in question. With them all, you may click to embiggen… although I tried to make them big enough to read as is. Enjoy!
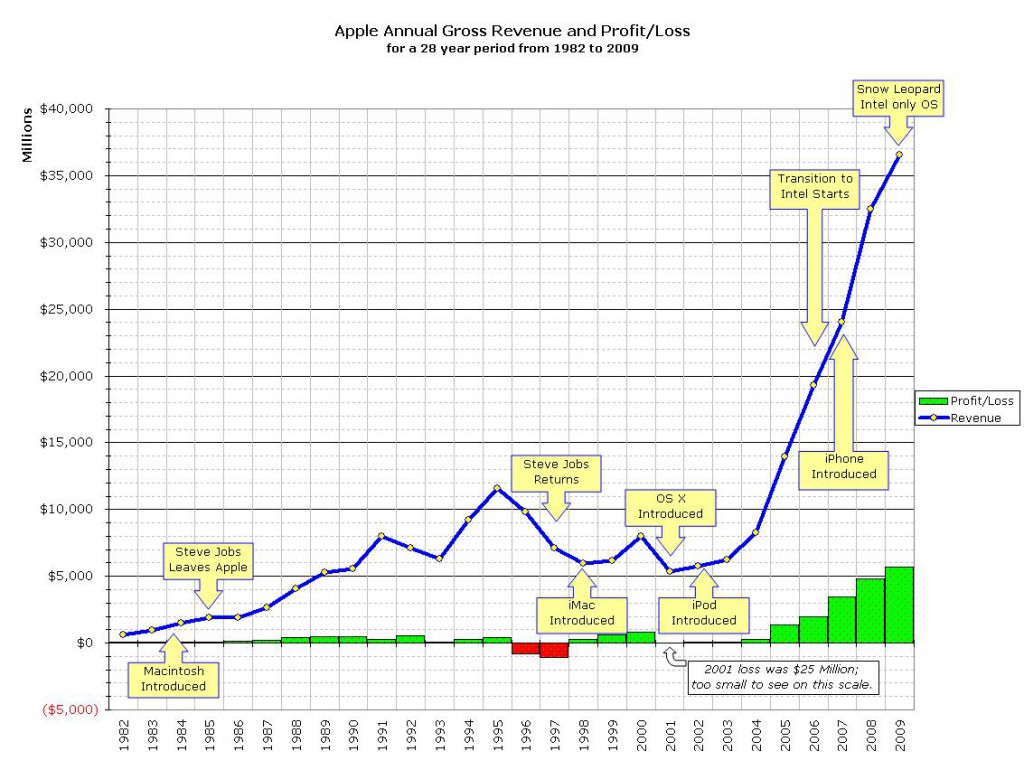
OK, this first chart shows the last 28 years of Apple’s gross revenue and profits/losses. I’ve also annotated some key events that occurred over that time frame. You can break the graph down into three sections:
For the first 14 years shown, from 1982 to 1995, things were pretty rosy for Apple. They made a profit every year and, with only a couple of exceptions, they increased revenue each year.
But, from 1995 to 2001, things were different. Over this period, again with a couple of exceptions, their revenue decreased each year. And they posted a total of three losses; $800 Million in 1996, $1 Billion in 1997 and (a relatively piddling) $25 Million in 2001. Yes, Steve Jobs had returned, and yes, the iMac was helping them turn around… but Apple was obviously a large ship that took time to steer.
The final section, from 2001 to the present, is the most dramatic. Once again, each year has been profitable, and this time, there are no exceptions; revenue has been up each and every year. In 2005 they blew past their previous best year, the high point from 10 years previous in 1995, and the new high point (the most recent results from 2009): $36 Billion of revenue in a single year.
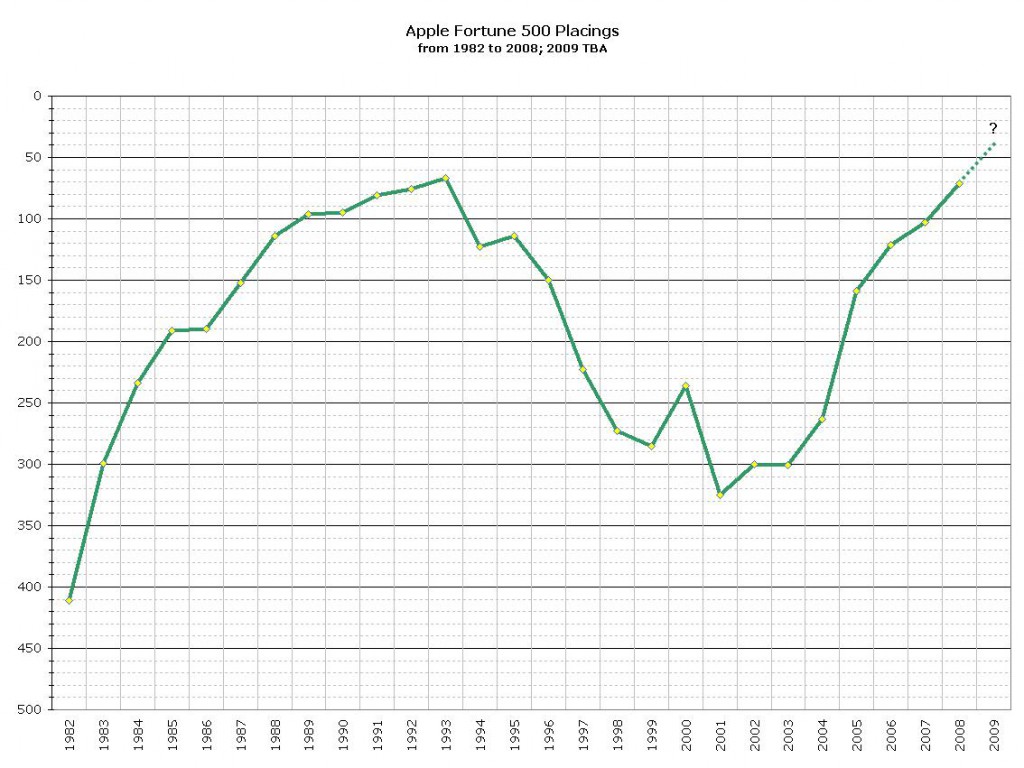
Now, the data in the first chart was gleaned from past results and placings of Apple on the venerable Fortune 500 list. So I am throwing in a graph that shows those results over the same 28 year period. I have “flipped” the graph so that the better the result, i.e., the higher up the list they are, the higher the line is. As you can see, the results are similar to the graph of their overall gross revenue… which is not surprising, as Fortune 500 position is determined by that statistic. The fact that their Fortune 500 peak was in 1993 rather than 1995 is probably attributable to how other companies on the list did in those years.
Apple debuted on the list at 411th. Their best result was in 1993, at 67th, while their 9 year resurgence put them at 71st in 2008. Obviously, their 2009 results have yet to be analyzed and placed on the next list; that should come out sometime in the Spring of 2010. I am confident that they will have increased their placing from 2008, and also confident that they will post a new best result, beating that of 1993. The interesting question is, will they make it into the vaunted “top 50” category? Given their performance relative to some other companies who seem to be harder hit by the recession, I’d be willing to bet “yes” on that point.
So, enough of the historical perspective. How about the initial question; from what sector of its business does Apple derive most of its income? To answer that, let’s look at the last 9 years in a bit more detail:
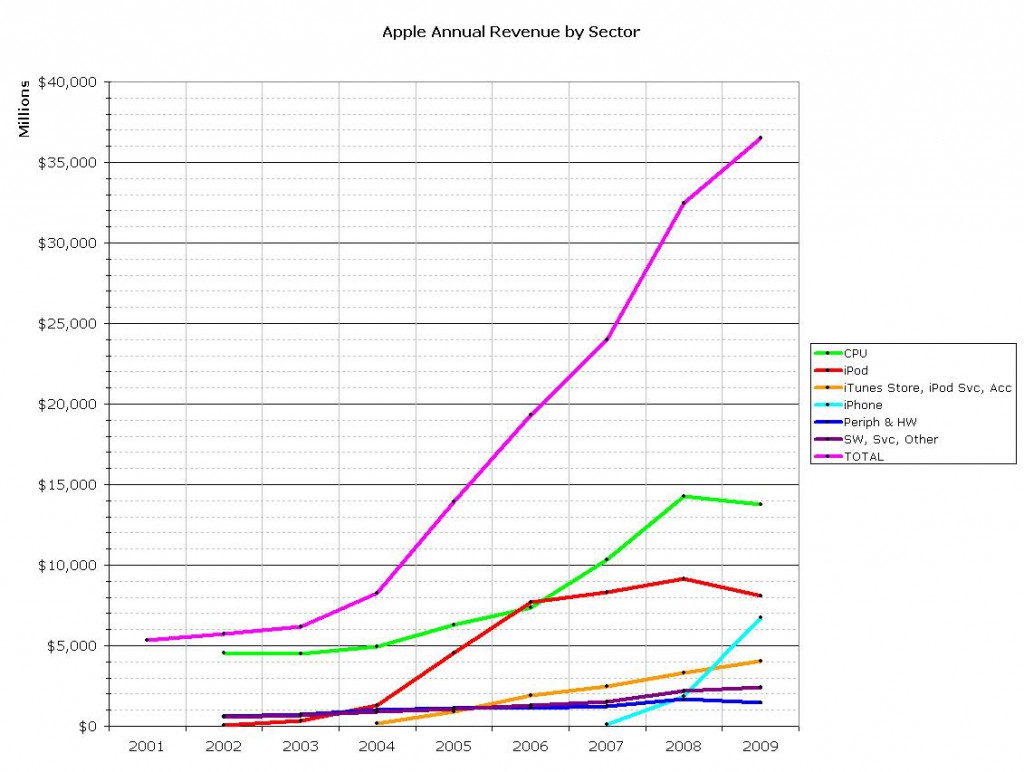
This graph shows Apple’s annual revenue for the past 9 years, broken down by sector. Just as a note, prior to 2001, their revenue was essentially composed of “CPUs and Miscellaneous.” But, as you can see for the most part, Apple’s primary source of revenue remains CPU sales. 2006 was the exception; in that year, iPod revenue just barely eclipsed CPU revenue. But the interesting part of this graph is the right hand end. As you can see, from 2008 to 2009, annual iPod revenue is down for the first time since its introduction, as is CPU revenue. The culprit would appear to be, from this graph anyway, the iPhone. I think it is logical to assume that iPhone sales are stealing iPod sales. Since the iPhone is also an iPod, it is probably a safe bet to say that folks are upgrading / replacing their older iPods with iPhones. I would not be comfortable, however, making any conclusions about iPhone sales stealing from CPU sales, even given that the iPhone can be considered, for some intents and purposes, a handheld computer. The decline in CPU revenue may be more related to the economy than anything else. But, since overall revenue was up, we can conclude that Apple has successfully diversified its revenue sources, becoming better able to weather a recession in the process.
The data for this graph comes from Apple’s own quarterly data sums, and we should note also that Apple has been accounting for iPhone revenue using GAAP methods, that is, over the expected life of the product. They are apparently reconsidering that policy, so it will be interesting to see how that affects this graph in the future.
So, let’s drill down even further, and look at the last 9 years on a quarter-by-quarter basis:
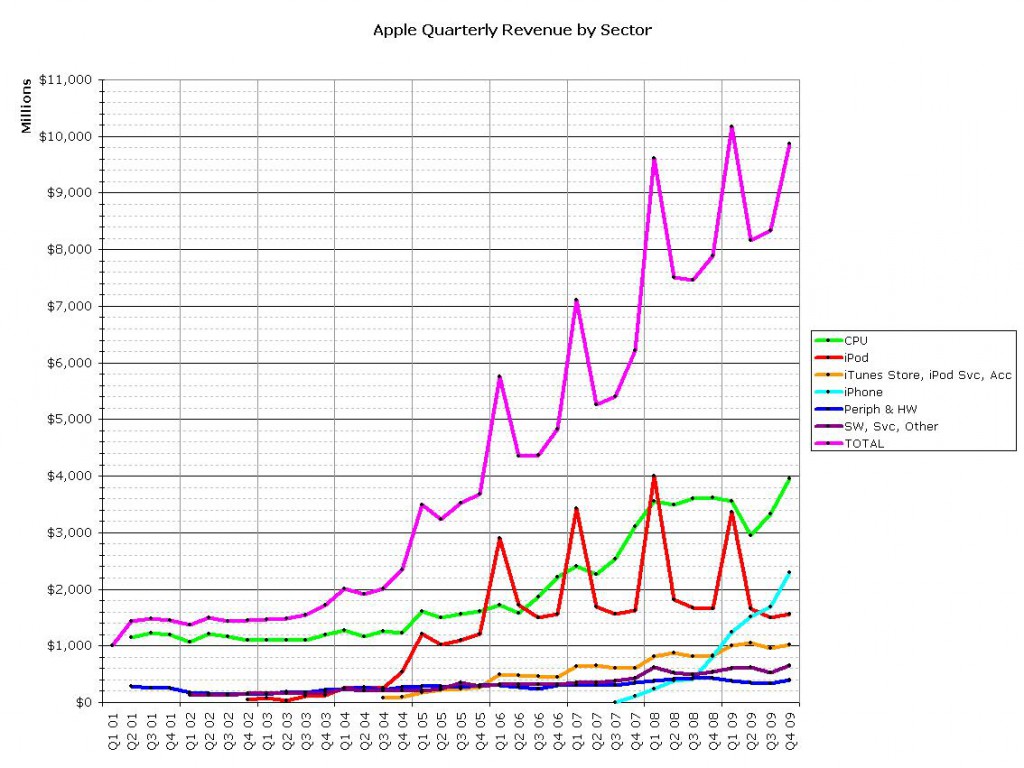
Now this graph has a very interesting and beautiful line. That “sawtooth” line in iPod revenue, driving the same pattern into the overall gross revenue; what causes that? Well, when you think about it, it’s obvious. The peak occurs in the first quarter of each of the past 5 fiscal years. First fiscal quarter matches to the last three months of the previous calendar year. October, November, December. The Holiday quarter. iPods make great Christmas presents, don’t they?
Looking closely, the spike does appear, albeit not as dramatically, in CPU revenue, but not, at least thus far, in iPhone revenue. It will be interesting to see what happens this Christmas, and how that is reflected in the first fiscal quarter of 2010. As you can see, it took iPod a couple of years to start showing that Christmas spike.
Note also that the annual decrease in CPU revenue from 2008 to 2009 seems to be rooted almost entirely in the second quarter of FY 2009.
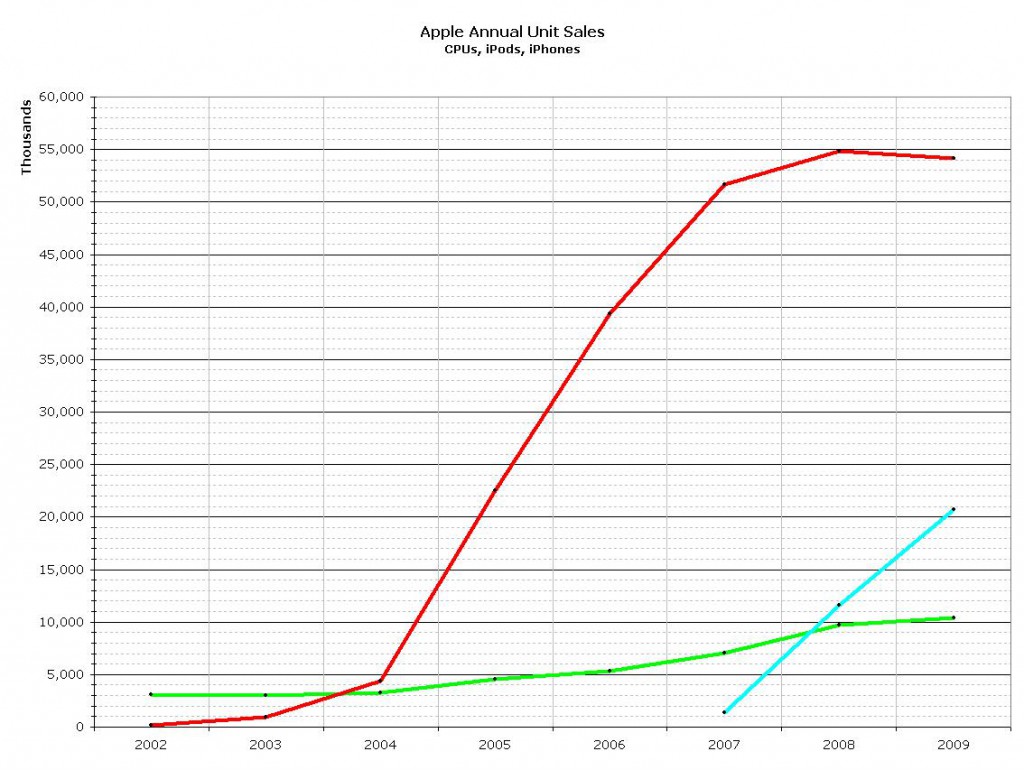
OK, money is all well and good, but what about units sold? OK: two graphs in a row, to get this moving along:
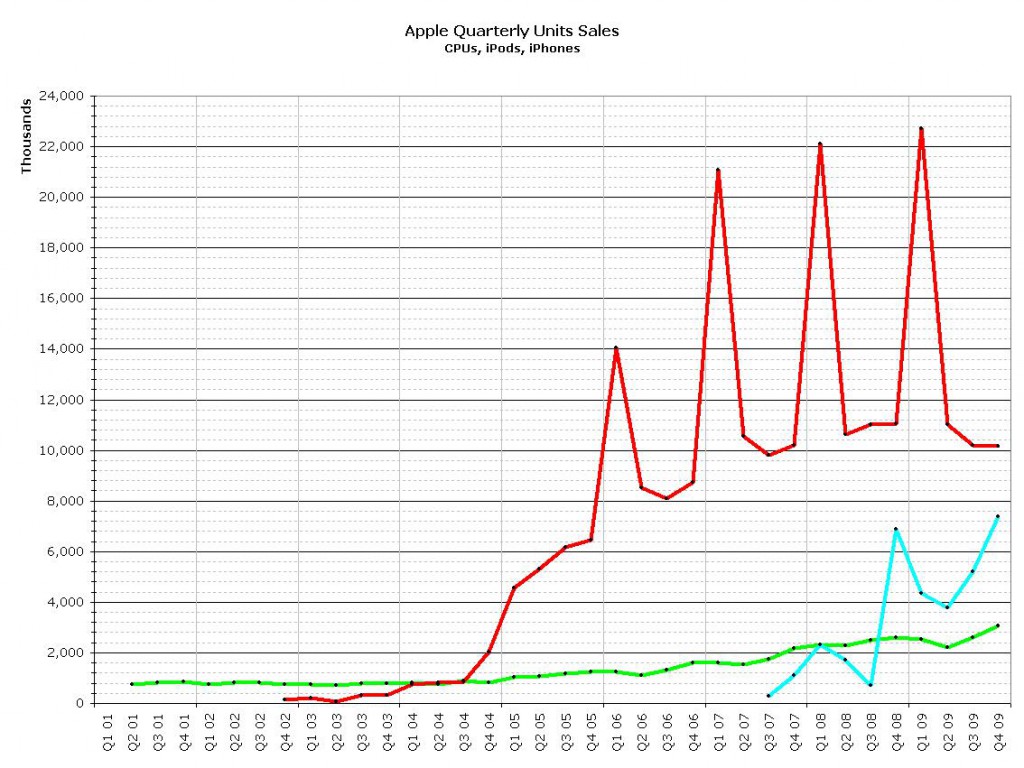
On a quarter-by-quarter basis.
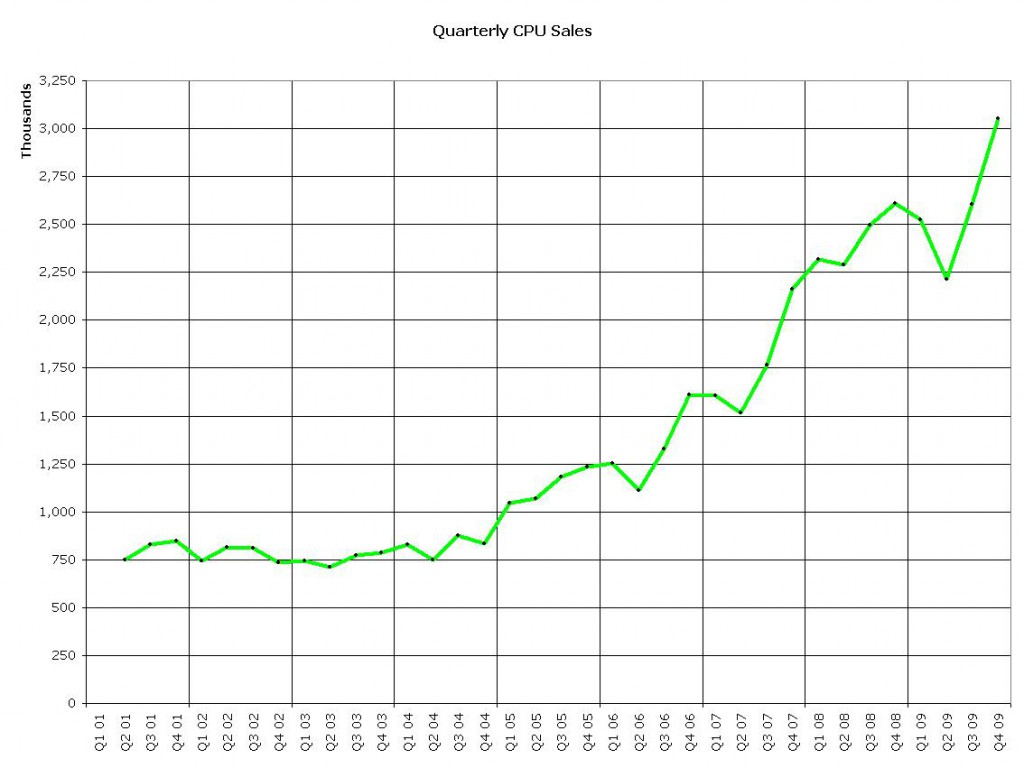
Again we can see the “first time ever” annual decrease in iPods sold, and the sawtooth pattern in there, as expected, on the quarterly graph. And even though Apple is selling more iPods and iPhones than CPUs, the part of these graphs that I think is significant is the steady increase in CPU sales. It may seem a slow increase on this graph, but if we pull out only CPU sales:
It is much more dramatic and interesting. Note that the second quarter drop in CPU sales seems to be a relatively common pattern. Now, given that the answer to the initial question is “yes, Apple is still, primarily, a computer selling company,” the fact that their CPU sales are showing this kind of increase year over year is very comforting. They sold more than 10 Million CPUs in 2009, 3 Million in the last quarter alone. Time will tell if they can keep that momentum going, but given the gorgeous hardware they announced yesterday, I think it’s a safe bet to say “yes they can.”
